
Introduction to the Fosway 9-Grid™
9-
What is the 9-Grid™
The Fosway 9-Grid™ helps you compare HR and learning tech solutions so you can choose the best fit for your organisational needs. It analyses learning and talent systems across five key dimensions: Performance, Potential, Market Presence, Cost, and Trajectory.
Backed by 30 years of research and insights from leading European companies, the Fosway 9-Grid™ goes beyond simple market analysis, suggesting actions you can take to get the most from your chosen solution provider.

The 9-Grid™ Model
The Fosway 9-Grid™ analyses HR, talent and learning vendors for European organisations – and it emphasises practical needs, catering to a range of budgets and complexities.
How is the 9-Grid™ different from other Tools?
It’s different to many US-centric models:
- It is five-dimensional
- There is value in all zones; Top Right doesn’t mean it is the best solution for you!
- It is European first
- It aims to be accessible to all HR professionals
What are the goals of the 9-Grid™ model?
Its goals are to enable you to:
- Understand how solutions compare
- Match solutions to your context
- Be a focus for constructive discussions
- Understand the wider opportunities
- Recognise the focus for success
Understanding The 9-Grid™ Zones
The 9-Grid™ model uses a similar approach to the 9-box models used in talent management succession planning, so for HR professionals the model should have some real resonance. One of the most important aspects of the model is that all positions have merit, just as they do with succession planning.
Each Zone is more than just a rated position; the Zones also provide an underlying agenda for managing vendors. For each Zone, there is a recommended, high level set of actions, designed to help you to maximise the benefits of working with the vendors from a particular zone. The nine Zones that form the 9-Grid™ model identify the relative potential and performance of the vendor.


What do all the zones mean?
Vendors are placed in a Zone depending on whether they have been assessed as a lower, mid-level or higher level performer and whether they have been rated with higher, mid-level or lower potential.
Note: All vendors within a Zone are considered as materially equivalent in terms of Performance and Potential. The relative position within a Zone only highlights our view of their Trajectory within the 9-Grid™ (see later).
An explanation of each of these Zones is outlined by rolling over the image to the left.
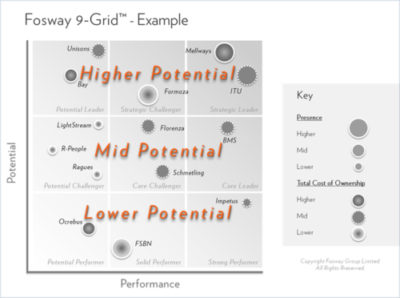
Understanding The Bands Of Potential
Potential is defined as a solution’s scope and sophistication. In our 9-Grid™ model these are banded into Lower, Mid or Higher Potential. And these provide the vertical positioning in the grid.
Lower Potential Solutions
Lower Potential Solutions tend to have lower levels of solution capability and sophistication. As a result they tend to address the needs of organisations with simpler requirements, or in simpler ways. Lower Potential Solutions are typically entry-level solutions which can deliver for organisations with lower levels of organisational complexity.
Mid Potential Solutions
Solutions identified in the Mid Potential band are rich solutions which meet the majority of needs of an enterprise-class customer, but don’t have the full depth or breadth of the specialist leaders. Mid Potential Solutions typically appeal to customers who are looking for a broad solution that covers all the bases but may have to compromise slightly on depth.
Higher Potential Solutions
Solutions in the Higher Potential band typically have higher levels of sophistication and scope. They have greater capabilities in terms of their depth and breadth than most other solutions in the market. As a result, these solutions tend to be able to handle the complex needs of large, enterprise customers more effectively than solutions of Mid or Lower Potential.
Understanding The Bands Of Performance
Performance has two important factors which can influence the position in the 9-Grid™; namely Market Performance and Customer Performance. These variables are combined to provide the horizontal positioning on the grid.
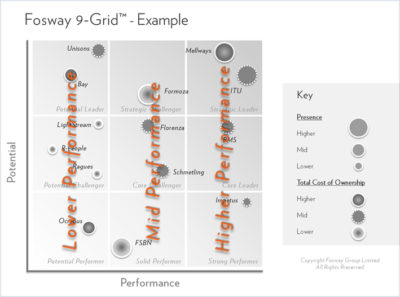
Lower Performance Solutions
Lower Performance Solutions typically have lower levels of market performance or lower levels of customer performance than others in the market. These solutions are characteristically placed in this band because they have a lower track record in achieving customer advocacy or lower market traction (shortlist and win rate) from enterprise-scale customers. Lower Performance can be the result of customers experiencing poorer levels of execution or customer service.
Mid Performance Solutions
Mid Performance Solutions are placed in this band for a combination of reasons that result from their market and customer performance. Mid Performance Solutions typically perform well in the market and with customers, but are not considered Higher Performance Solutions because they have lower customer advocacy or have yet to achieve the market success of higher performing solutions.
Higher Performance Solutions
Higher Performance Solutions typically display both higher market and customer performance. These solutions are typically more frequently shortlisted by enterprise scale organisations and they more frequently win competitive tenders from enterprise corporate companies. Importantly, customers of these Higher Performing Solutions also achieve higher levels of customer impact and advocacy compared to other solutions in the market.
Vendor Placement Within A 9-Grid™ Zone
When we place vendors in a particular Zone, this is an absolute label which applies to all vendors in that zone. So, all vendors placed in a Core Leader Zone are all Core Leaders and materially equivalent.
The relative position within a Zone does not denote superiority. Although we talk about Trajectory as one of the dimensions of the 9-Grid™, it is actually two-dimensional, reflecting the relative change in Performance and Potential. We place vendors in different parts of the Zone to show our view of their likely Trajectory in the market.

What Does The Relative Position In A 9-Grid™ Show?
The relative position in a Zone does NOT mean that one provider is relatively better or worse in terms of their performance or potential than the others in that Zone. What is shows is our view about how they might move within the 9-Grid™ over time (relative to the market as a whole.
- Vendors at the top of a box are building their Potential through innovation and enhancements
- Vendors at the bottom of a box are, in our opinion, potentially going to lose ground in the future in terms of their innovation or solutions capability when compared to the rest of the market
- Vendors on the right of the box are trending to increase their win-rate and/or customer advocacy and recognition in the market. Our expectation is that in the future they will be getting short-listed and winning more often, or deliver better
- Vendors on the left are decreasing in customer advocacy and market success. Our expectation is that in the future they will be getting short listed and winning less often, or struggle to maintain their customer performance.
Anyone who is in a corner is changing in two directions at the same time. Where a vendor is placed at the centre of a zone, we see that vendor as not changing their performance or potential significantly relative to the market as a whole. They are keeping pace with the market in terms of both performance and potential.
Examples: Vendor Trajectories
To help illustrate how this works it is sharing worth customer, using the diagram below, which focuses on a sub-section of the 9-Grid™.
Here we have four vendors placed in four of the 9-Grid™ Zone. These have Trajectory or directions of travel for where we anticipate they might move to, relative to the market. One is expected to remain in Zone.

In this example, we see:
- Vendor A is shown as mid-right in a Zone, that implies a relative increasing rate of performance and stable rate of growth in potential – relative to itself and the market as a whole. We call this position an ‘Accelerating’ Trajectory, showing it further improving its market and customer performance, whilst at the same time continuing to demonstrate similar potential in the market.
- Vendor B has an ‘Expanding’ Trajectory and is increasing their level of innovation and potential to serve enterprise customers more effectively and are maintaining their level of market performance and customer advocacy.
- Vendor C has a ‘Realigning’ Trajectory as they are decelerating their level of innovation relative to previously and the wider market at this level, thus reducing the velocity at which they expand the scope and sophistication of their solution, and have slowing market growth or customer advocacy.
- Vendor D has a ‘Maintaining’ Trajectory as they are maintaining their level of innovation and potential to serve enterprise customers as well as their market performance and customer advocacy.
Remember: The relative position within a Zone does not show relative difference. In this example, Vendor C and Vendor D are considered to be materially equivalent in terms of Performance and Potential, but we believe they may have different Trajectories.
DOWNLOAD FOSWAY 9-GRIDS™ FOR:
THE FIVE DIMENSIONS OF 9-GRID™:
HOW WE CAN HELP YOU
Why start your procurement process from scratch when we already have the research and insight to help you make better supplier decisions much faster? We can give you the inside track into any potential suppliers you are thinking of working with, as well as input into your HR, talent and learning strategy and projects.